
”Repertoire” was a keyword at the Comédie-Française Registers Project Conference in Cambridge, MA. Spurred by a number of papers (including those by Jan Clarke, Bill Weber, and Pannill Camp), I developed four attempts to visualize the stability and variety of the troupe’s repertoire from 1680 to the Revolution. As a newcomer to the Comédie-Française and to eighteenth-century French theater generally, I offer these charts with some trepidation. Consider them experiments in seeing how repertoire evolves, rather than answers specific questions about the Comédie-Française and its repertoire. The latter requires longer study and more expertise than one weekend and my limited knowledge can offer.
First, two glimpses of how the company develops repertoire. Figure 1 shows each decade’s repertoire, segmented by the decade in which plays premiered at the Comédie-Française.
A few points suggest themselves immediately. First, of course, we see the long dominance of the 1680s repertoire (again, including a significant amount of pre-1680 work), which seems to drop only barely below 20%, and then only in one decade (the 1780s). Second, the top segment of each column is always a decade’s premieres. A quick glance across the top of the chart reveal the 1730s as an unusually productive decade in the eighteenth century. Third, the 1690s, 1700s, and 1710s repertoire seem, as a group, to occupy a relatively stable percentage of the repertoire from the 1720s through the 1750s (with temporary backsliding in the 1740s). (These are the blue, orange, and green segments.) To maintain that repertoire, the troupe sacrificed some of its durable 1680s repertoire in the 1730s to keep in rotation the still-popular works from 1690–1719. This is clearest in the steep drop in 1680s repertoire from the 1720s, where the 1680s account for approximately 40%, to the 1730s, where the 1680s occupy closer to 30% of the repertoire.
The calculations in the above chart count the repertoire as a unique set of works. Whether a work is performed 1 or 30 times, it counts as an equal portion of the company’s repertoire. One might reconstruct this chart counting performances instead, as in Figure 2.

The next chart will try to look at the impact and durability of each season’s premieres in more detail. This is a complicated chart, so let’s construct it step by step. Consider the 1750 season. (While seasons actually cross the calendar year, for convenience I name seasons by the first year. The 1750 season thus should be understood as the 1750–51 season.) We can make a simple chart displaying every season in which a play that premiered in 1750 was subsequently performed. It might look something like Figure 3.

But, wait: what if more than one work from 1750 were reperformed? How do we know how many works we’re talking about here? Let’s remake the chart, this time setting the circle’s color (on a grayscale from 0% equals white to 100% equals black) to the percentage of 1750 premieres that are performed in a season, as in Figure 4.

One more wrinkle: how can we tell whether or not the reperformed works are the same subset? That is, imagine that five plays, A, B, C, D, and E premiered in a season. In the next season, A and B are reperformed, giving us a 40% black circle. But in the subsequent season, C and D are reperformed. Our circle is again 40% black, but we’ve lost any sense that the repertoire over this two-year period includes not 40% of our plays, but actually 80%. So we will make for our chart one more piece, a horizontal line for each work, extending from the premiere year and continuing to the last year in which the play was performed. Again, the darkness of the line is a percentage of the plays reperformed, from zero to one-hundred, white to black. The result is Figure 5.


Ok, that’s just the 1750 season. Let’s do the same thing for every season from 1680 through 1792 and put them on a single chart.

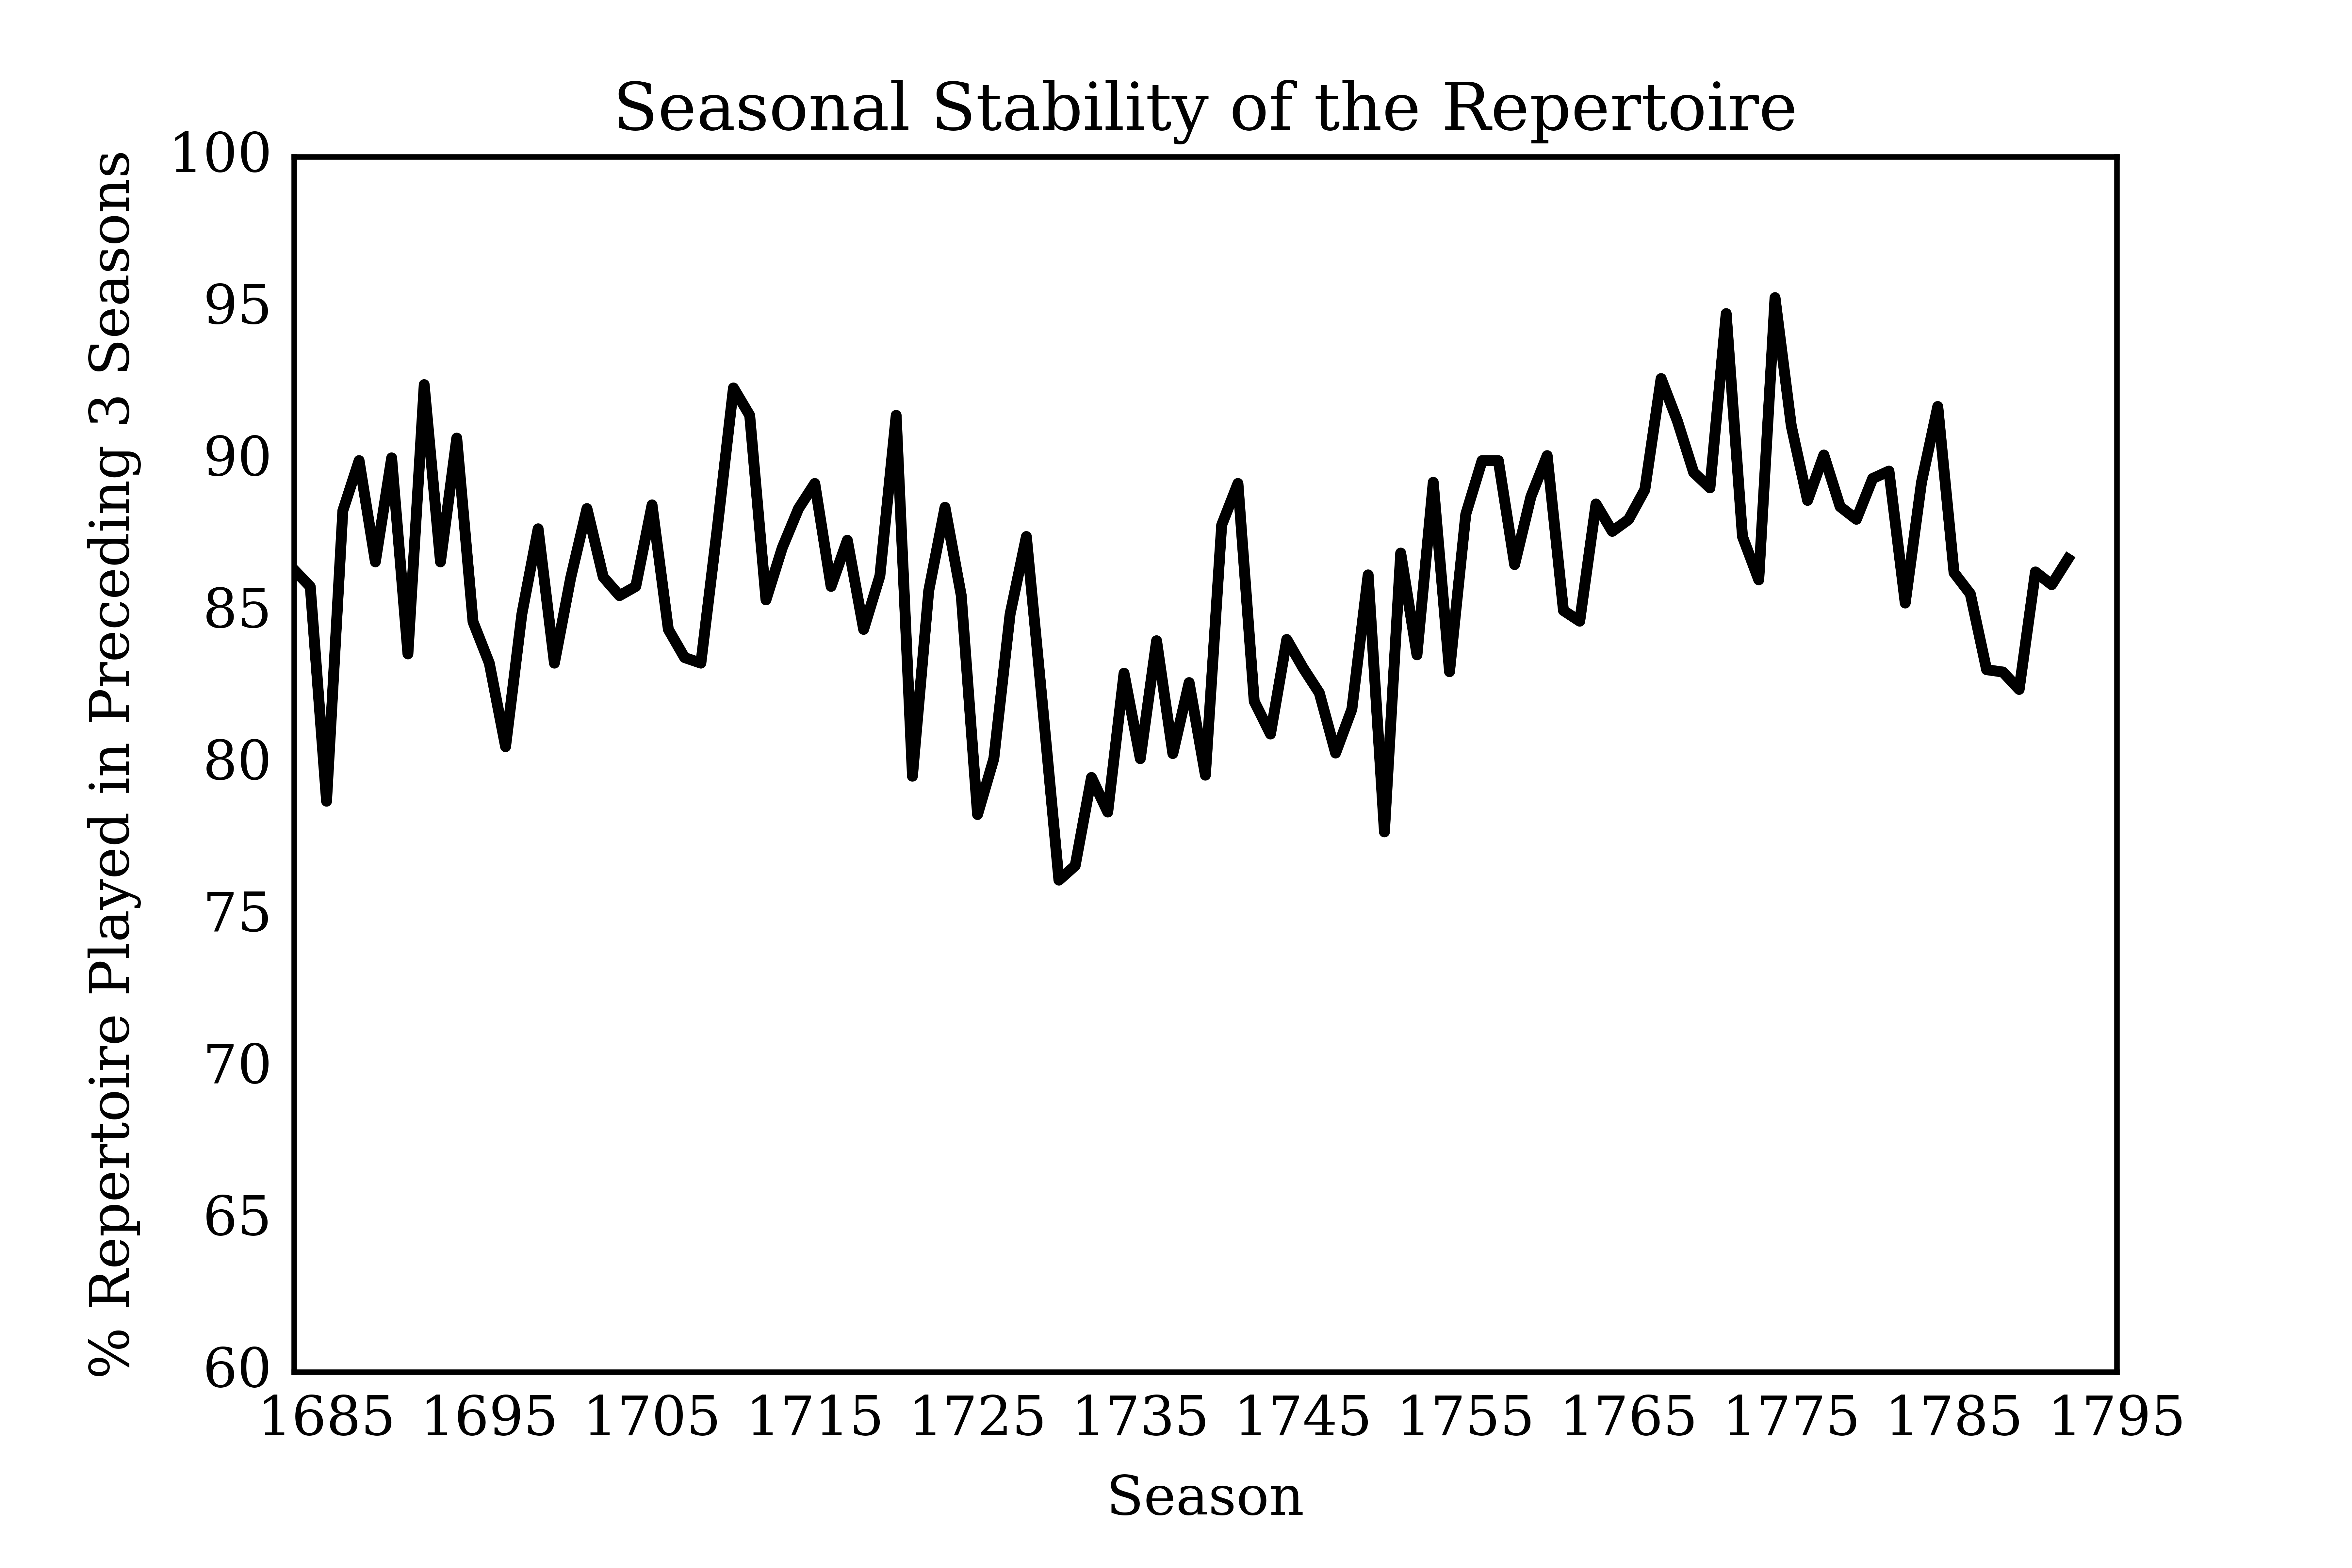
The three preceding charts all offer a look at how successful works from a given decade or season were in subsequent years. They try to capture the persistence of works from a given period over the full time period of the data. But we might also think about repertoire on a smaller scale, focusing on the year-to-year turnover. Figure 8 charts the percent of a season’s repertoire that was also part of the preceding season.


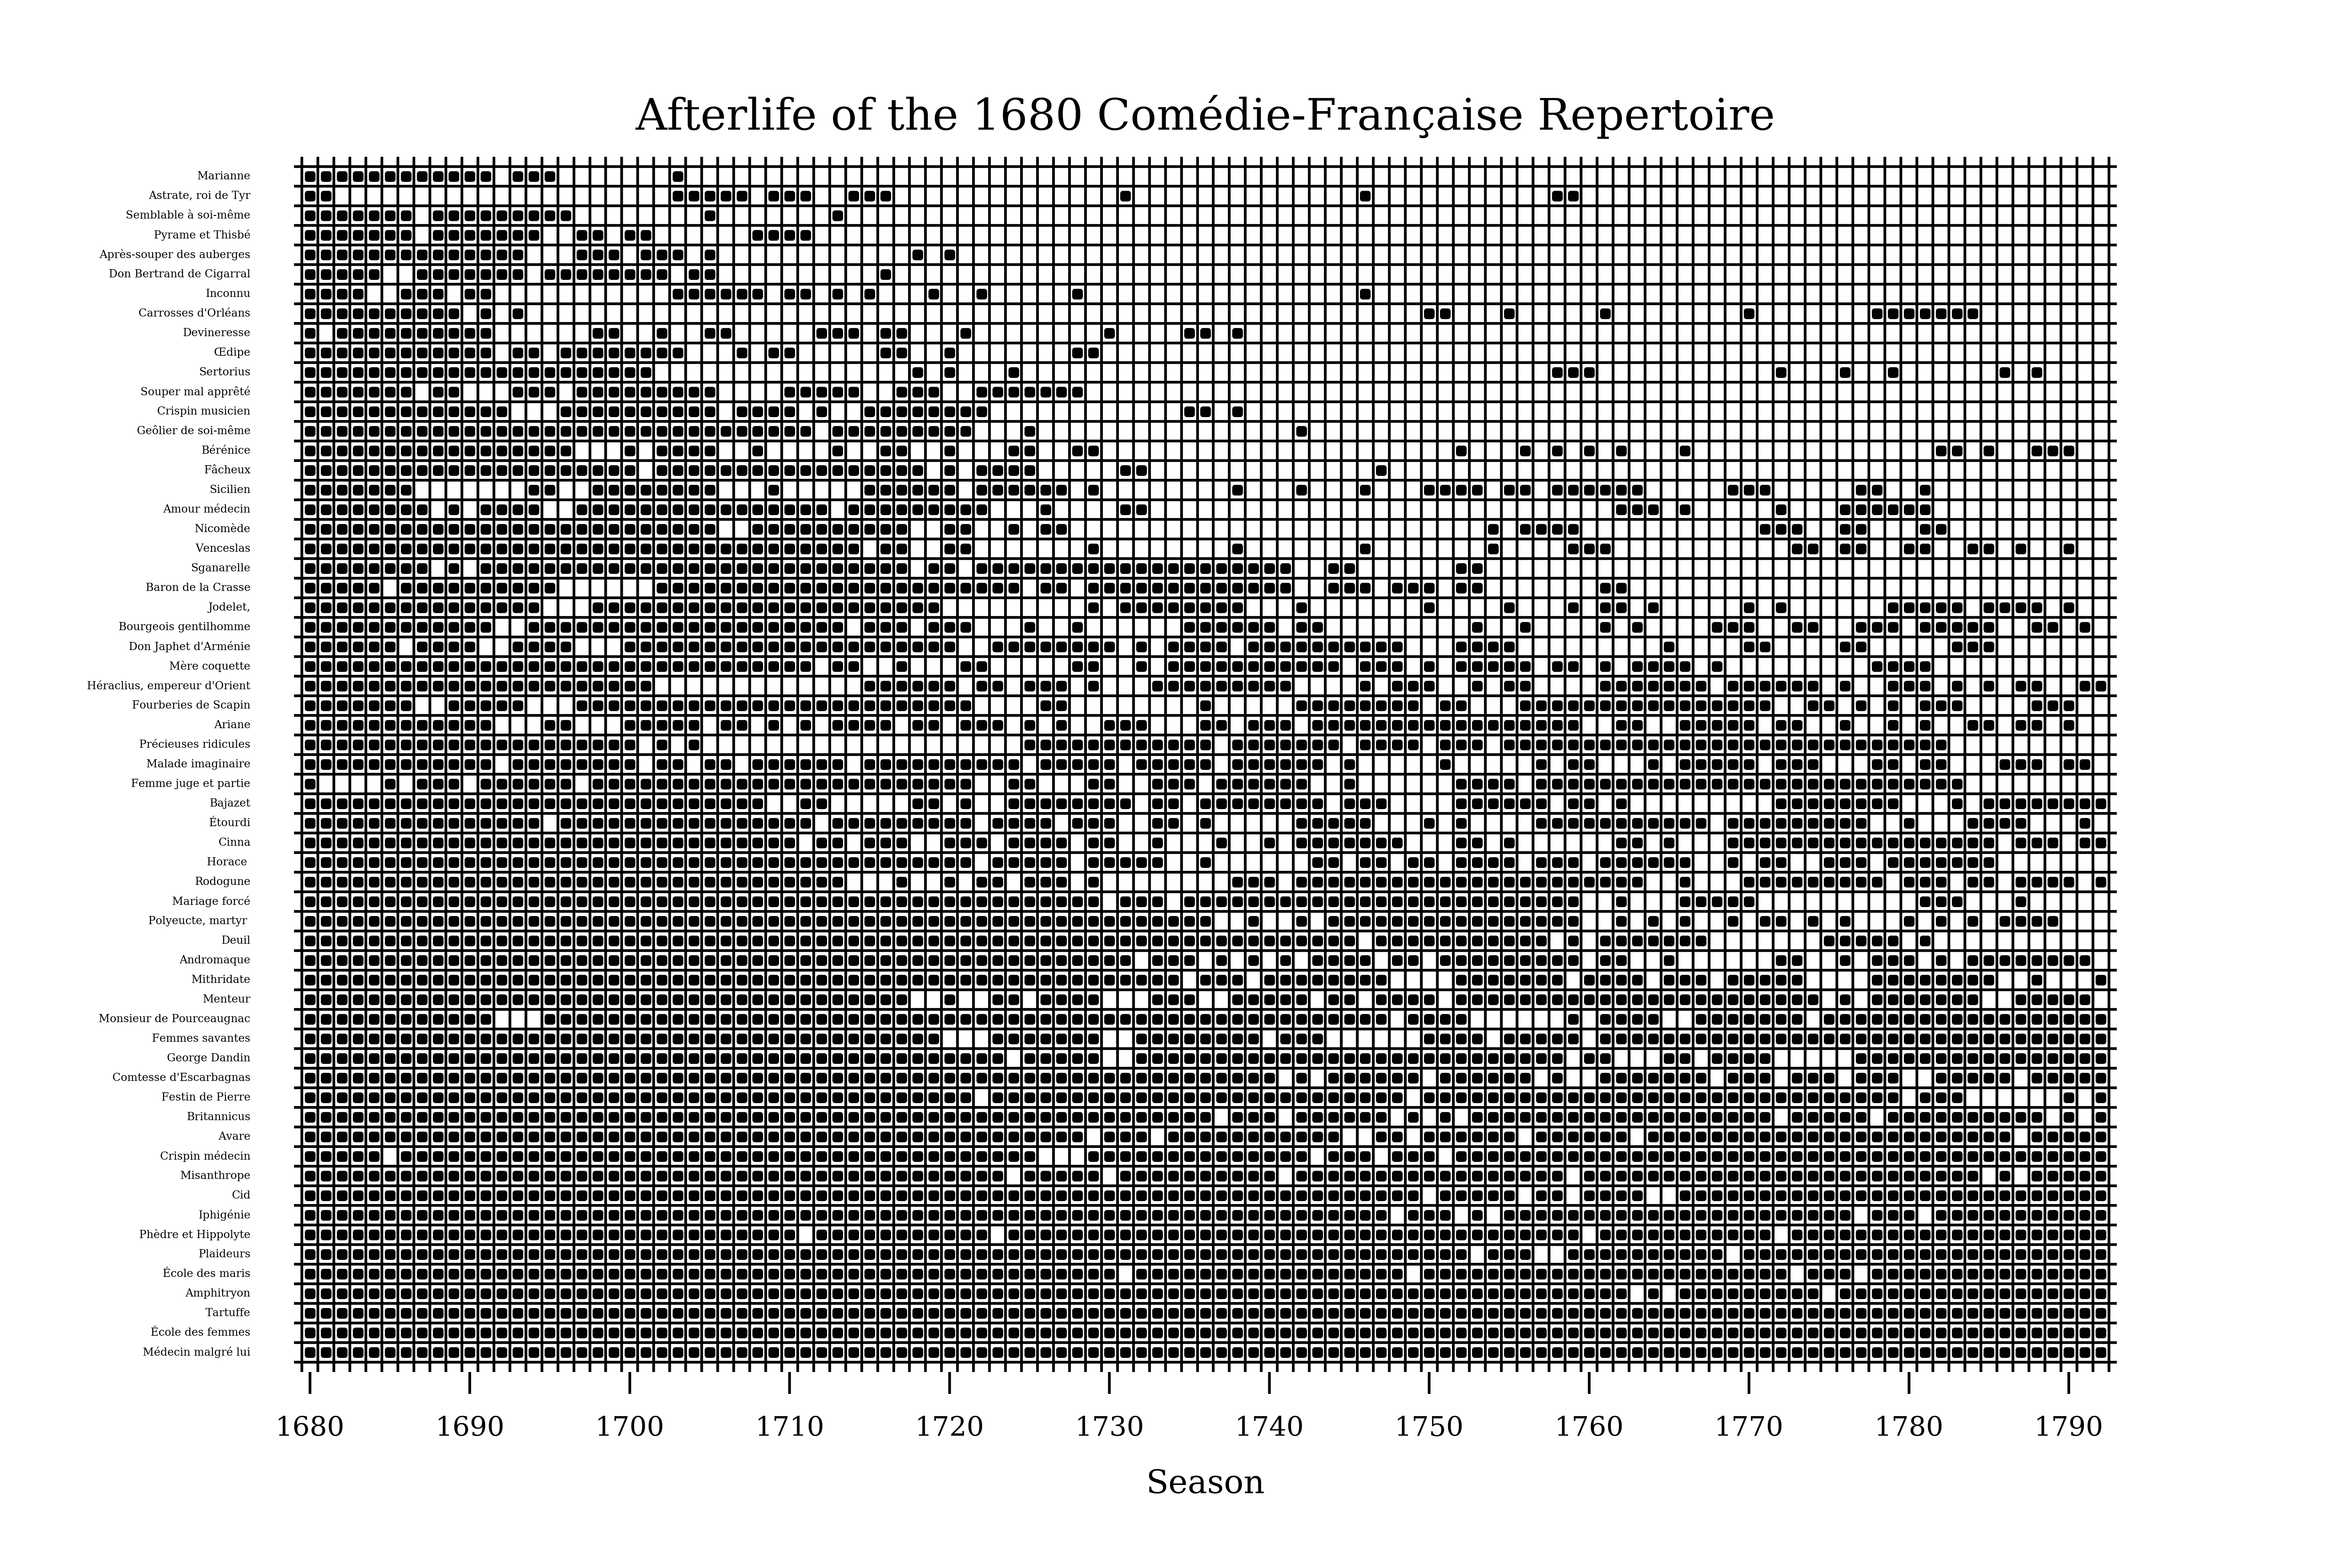
Finally, let’s take a close look at the single most important “premiere” season, namely the company’s first season, 1680. Again, by definition I’m exploring only company premieres, the first season in which a work was performed by the Comédie-Française, constituted as such. Thus all the works by Molière, for instance, that the company performed in 1680 “premiered” in 1680, although they had actually premiered years or even decades earlier. In other words, we’re examining, by and large, the established, neo-classic repertoire of the French theater as utilized by the Comédie-Française up to the Revolution. (Some pre-1680 works first appeared in the company’s repertoire in later years; I do not account for them here.) Figure 10 gives a play-by-play look at the 1680s repertoire and its persistence in later seasons.

The resulting chart divides roughly into thirds. At the bottom of the chart we have the true company mainstays. L’École des femmes, Le Médecin malgré lui, Tartuffe, each performed at least once in every season to the Revolution. Another dozen plays (Le Cid, Britannicus) with only intermittent performance gaps of a season or two, and then starting only in the 1720s. And then a handful more with somewhat longer periods of non-performance, but otherwise strong consistency from year to year. The middle third, say from around Le Menteur to Sgnarelle, has long stretches of popularity, but then disappears for 5 or 10 years at a time, often more than once. These plays are popular enough to sustain interest, but not so essential that they cannot be set aside. And then we have the top of the chart, successful or popular plays that, for the most part, had a more temporally limited appeal. Generally, these plays were successful to the 1720s, when the company either dropped them entirely or revived them only occasionally, but without any sustained interest.
Now, within this general tripartite division, individual plays follow their own unique patterns, patterns scholars better versed in the period’s dramatic literature would recognize more readily than I. For example, Jan Clarke noted to me during the conference that many of the company’s true mainstays are petites pièces, performed as a second or third play in an evening. (This is something one might verify, of course, with the data.) Les Femmes savantes is an example of a play for which a specific look at company practices might be fruitful. The five-year hiatus in the late 1740s marks a clear break in the company’s use of the play. Why? And what explains the sudden dismissal of Héraclius, empereur d’Orient in the 1700s, and the play’s relatively consistent return a decade later? Seeing the 1680 repertoire as a whole, the treatment of individual plays stands out more starkly and invites us to tell new stories about the Comédie-Française and its production practices.
I hope these charts contribute to that endeavor.
To download png files of the main figures, select the links below.
Derek Miller is an Assistant Professor of English at Harvard University. His research focuses on the intersections between art and industry in the nineteenth and twentieth centuries. More information at http://scholar.harvard.edu/dmiller.